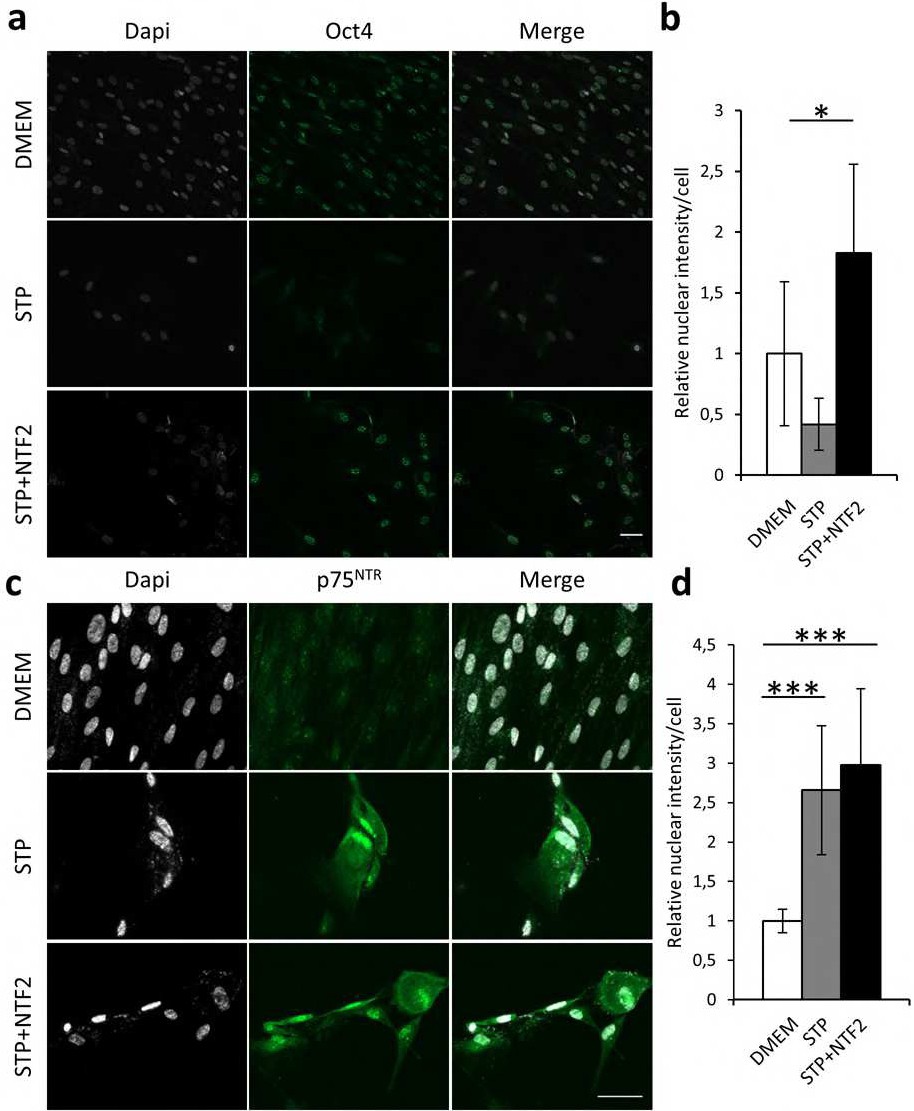
Fig. 5. Immunofluorescence analysis of OCT4 and P75NTR in hDPSCs grown in DMEM+10% FBS, STP and STP/NTF2 media: a) OCT4 immunostaining for DMEM+10% FBS, STP and STP/NTF2 growing hDPSCs. A higher IF nuclear signal corresponding to the active form of OCT4 is found in hDPSCs grown in BDNF/NT-3-supplemented STP. Scale Bar 50 µm. b) Graph showing quantification of nuclear OCT4 IF intensity per cell (n=3. *=p<0.05. c) P75NTR immunostaining for DMEM+10% FBS, STP and STP/NTF2 growing hDPSCs. A higher IF signal for P75NTR is found in hDPSCs grown in raw STP and BDNF/NT3-supplemented STP (n=3). Scale Bar 50 µm. d) Graph showing quantification of P75NTR IF signal in each condition. All statistics were analyzed by ANOVA following by Scheffe post-hoc analysis *=p<0.05, ***=p<0.001. Experiments were performed in triplicate.